What if data are not normally distributed?
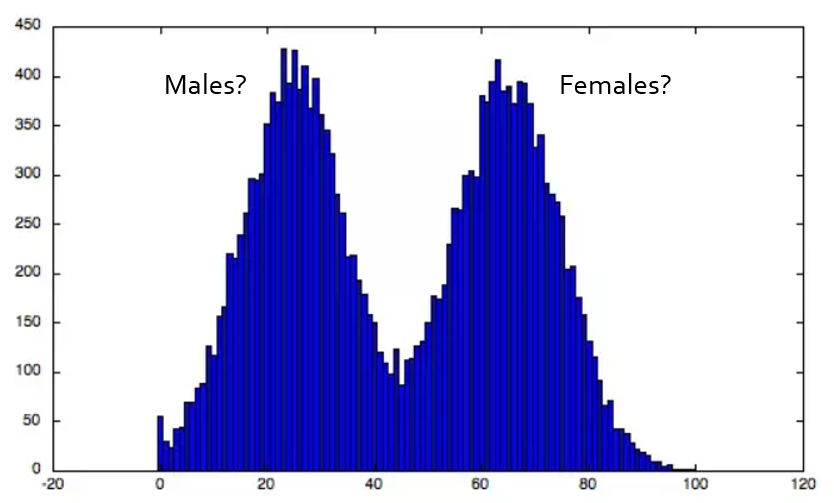
What if the histogram shows 2 peaks?
It’s an indication that there are 2 populations in your experiment. In this case you cannot simply assume that the data is normal because there are more than 30 measurements. You have to find the cause of the 2 peaks e.g. is there a clear difference between males and females? If so you have to measure the 2 populations separately. We will come back on this.
How to avoid log(0)?
Log transformation when there are zeros in your data is problematic. Often this issue is solved by adding a small number prior to taking the log. Such number is called a pseudo count. The value of the pseudo count depends on the data range. For RNASeq data where counts are typically between 0 and 10000s, a pseudo count of 1 is used. For data with a smaller range pseudo counts are much smaller than 1.