Introduction
AlphaPulldown (by EMBL Hamburg) is a Python package that streamlines protein-protein interaction screens and high-throughput modelling of higher-order oligomers using AlphaFold-Multimer. It provides a convenient command line interface, a variety of confidence scores, and a graphical analysis tool. (source: https://www.embl-hamburg.de/AlphaPulldown/).

The goal of AlphaPulldown is to verify a large number of protein-protein interactions, and to use the reported metrics to identify and estimate potential interaction partners. AlphaPulldown is installed on the HPC, and allows for a high degree of parallelism, avoiding redundancy. As seen in the figure, there are three stages that require completion before moving on to the next:
- MSA search (on CPU), once for each protein
- Structure predictions (on GPU), once for each interaction
- Results gathering and reporting (on CPU)
Inputs & Outputs
In this tutorial, we highlight the usage of AlphaPulldown on the HPC to screen all possible one-on-one interactions between two sets of proteins. Note that the software is fully installed and that you can also run the other modes (homo-oligomer mode, custom mode) by adapting the job scripts.
INPUTS. For our specialized script, the user needs to supply is two FASTA files, for which the all-to-all mode will be run. Finally, the user also needs to specify the output directory, and how many times each prediction model will be run to predict the interactions. For instance, if the user specifies a FASTA file with two proteins, and one with fifteen proteins, and wants each prediction model to be run three times, this would mean 2 * 15 * 3 * 5 individual structure predictions (the 5 is because there are five different multimer models).
OUTPUTS. The reported confidence metrics of AlphaFold2 are listed in a .csv file, for all interactions that reach a minimum confidence threshold (by means of interface PAE):
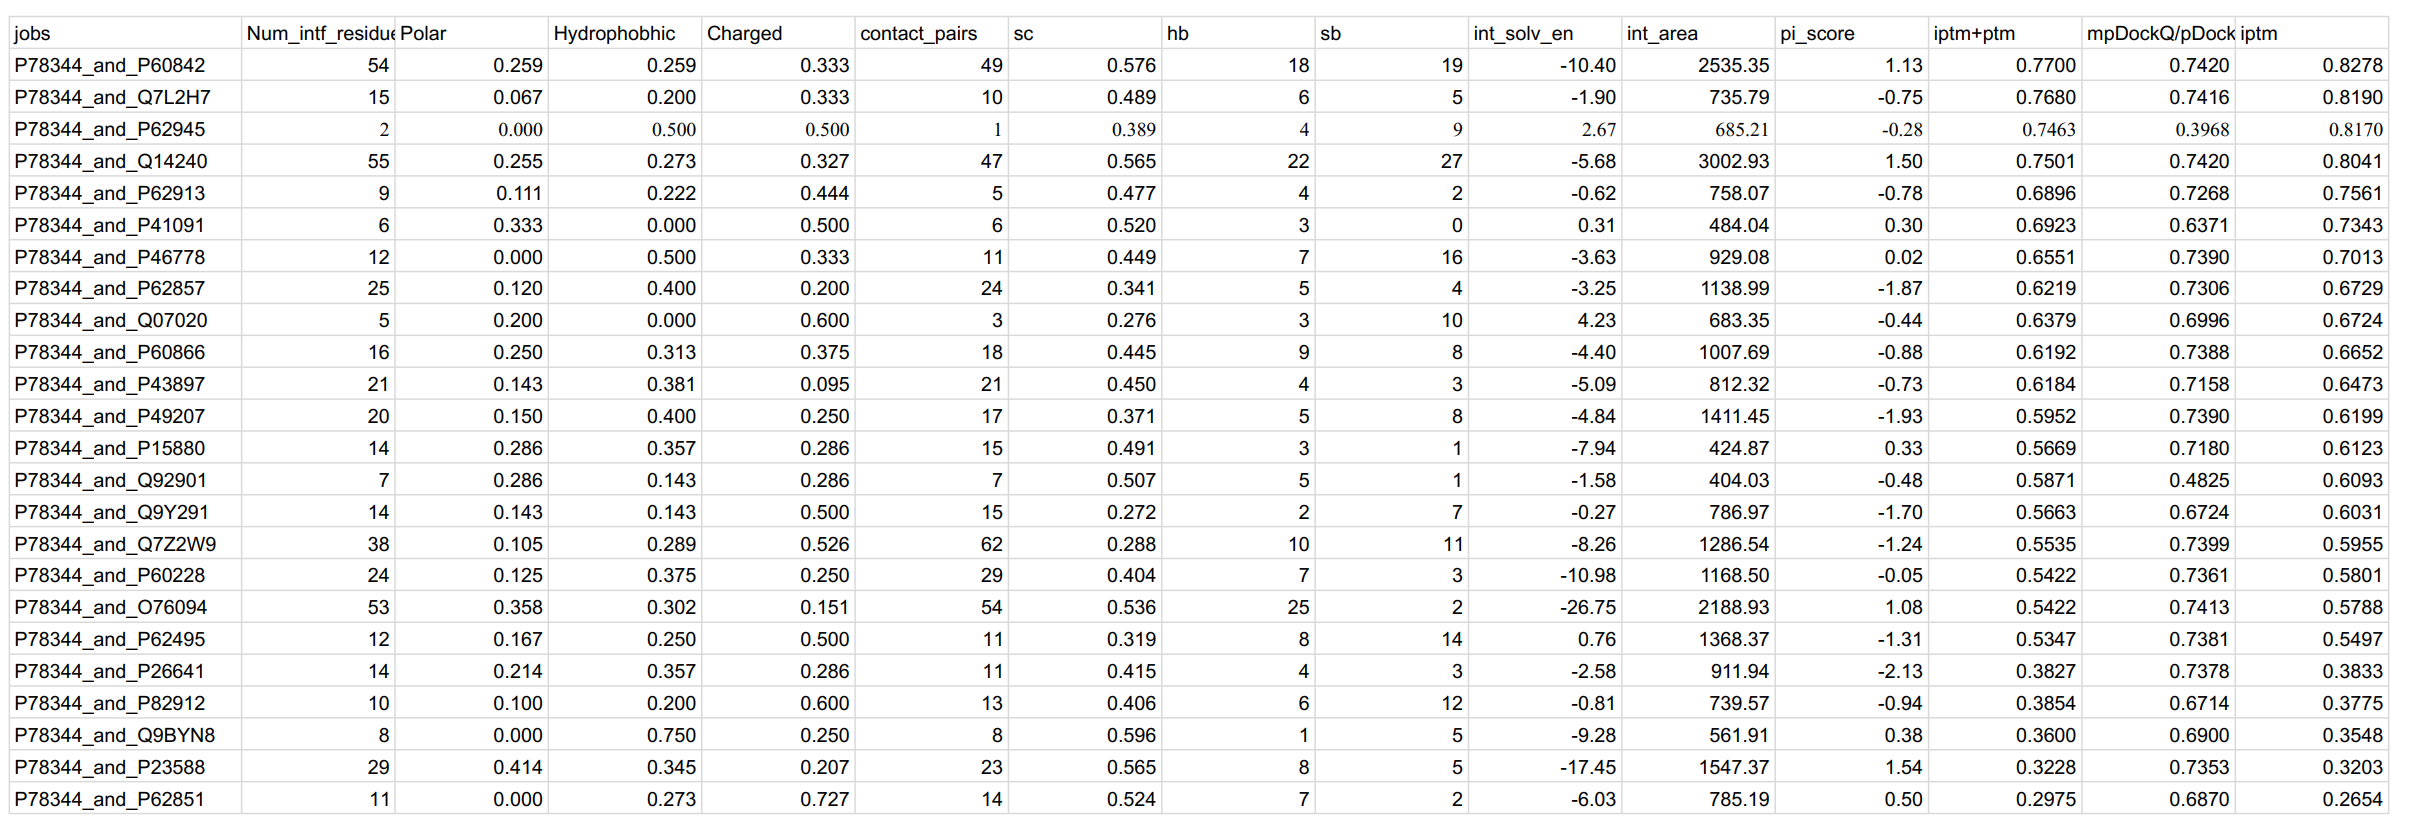
The most notable outputs here are the iptm, pi_score, and mpDockQ/pDockQ scores.
- iptm. AlphaFold-reported confidence for the confidence for the predicted interface region. From the EBI AF2 training documentation: Values higher than 0.8 represent confident high-quality predictions, while values below 0.6 suggest likely a failed prediction. ipTM values between 0.6 and 0.8 are a grey zone where predictions could be correct or wrong.
- PI-score. Protein interface score, see https://www.nature.com/articles/s41467-021-23692-x
- mpDockQ/pDockQ score. Predicted dockQ scores based on the predicted interaction, see https://www.nature.com/articles/s41467-022-28865-w. pDockQ scores ≥ 0.23 are considered to be correctly predicted.
Additionally, the user can get access to a Jupyter Notebook that visualizes the interactions that reach a certain confidence threshold (based on iPTM). (not yet included in this tutorial)