Instructions for running AlphaPulldown
Edit June 2025: The AlphaPulldown installation was updated by HPC-UGent after the upgrade to the RHEL9 operating system. The current version should be working, and the script on GitHub (link below) was updated.
Input preparation
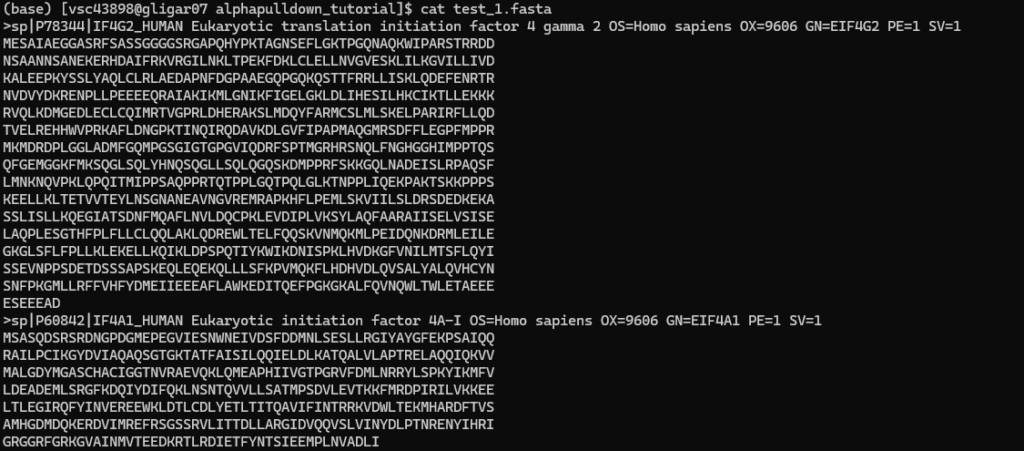
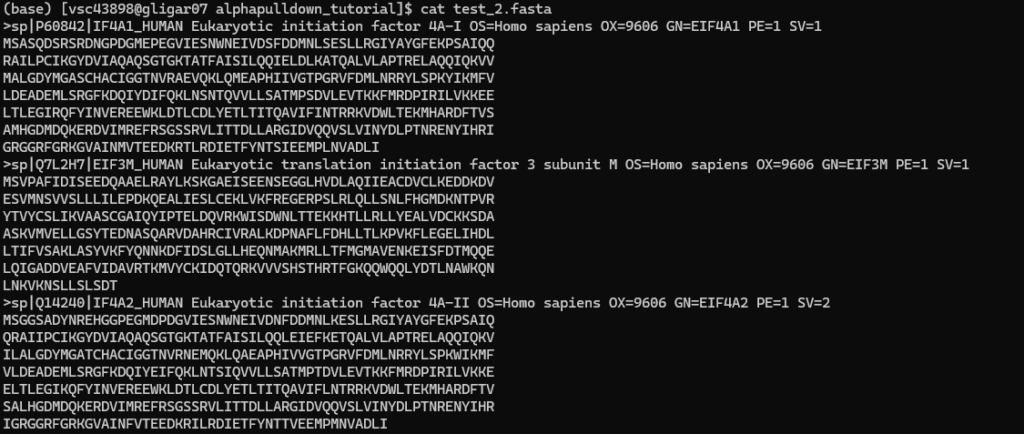
The user needs to create two FASTA files, and download the base script to generate the instructions for the individual AlphaPulldown steps. For example:

Step 0. Generating the individual scripts and instructions
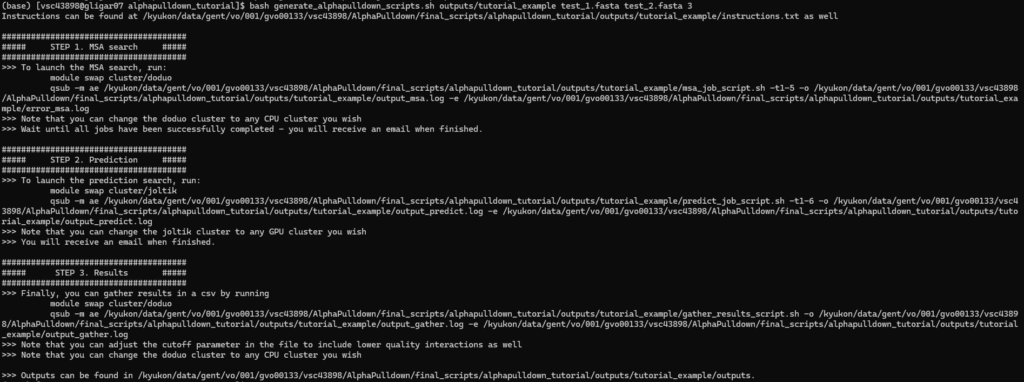
As AlphaPulldown is executed in a couple of individual steps, we wrote a general script that helps in setting up the individual runs. At the start of each AlphaPulldown experiment, you can run it once to get the specific instructions. Running the script requires four user inputs:
- the output directory where all generated output and log files will be stored
- the first FASTA file
- the second FASTA file
- the number of time each of the five multimer prediction models should be run
The script can be run by executing the following command:
bash generate_alphapulldown_scripts.sh <output_directory> <FASTA 1> <FASTA 2> <num_runs_per_model>
The required files and individual job scripts will be created, and the instructions on how to execute the three individual steps are shown in the terminal. They are also written to instructions.txt. For each of the three steps, you will receive an email (to the email address registered to your VSC account) when all runs within one step are finished, and whether they all failed, succeeded, or a mix of both.
An example of running the generate_alphapulldown_scripts.sh script:
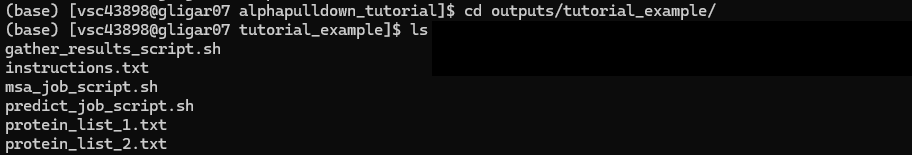
These instructions can now also be found in instructions.txt, located in the output directory that was specified, along with the job scripts and auxiliary files:
Step 1. MSA search
The MSA job that was created will create a job array that will do an MSA search for each protein in the two FASTAS. This step is done on a CPU cluster. By default, we suggest to make use of cluster/doduo, but you are free to specify another cluster here. Then, just submit the job script as described in the instructions. Make sure to copy the full command as it can stretch multiple lines.
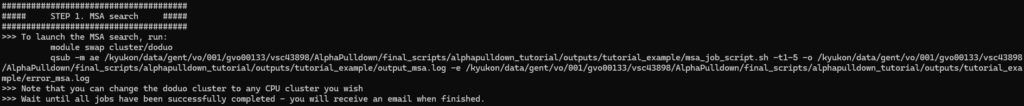
Once the MSA job script is submitted, you will see a single job waiting in the queue. However, since we actually submitted a job array here (the -t1-5 parameter takes care of this, but it is not necessary for you to understand), multiple jobs will launch when resources are available.
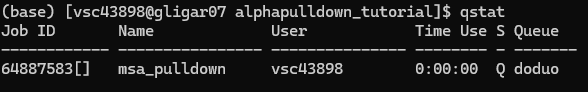
Initially, after submission:
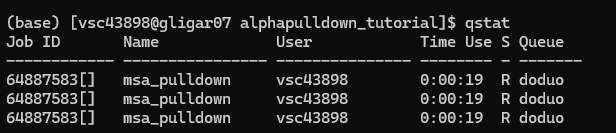
When jobs start to run:
After the jobs are finished, you will receive an email with the title indicating the results: either all runs succeeded, some runs succeeded and some failed, or all runs failed:
- [doduo] Slurm Array Summary Job_id=64888226_* (64888226) Name=msa_pulldown Ended, COMPLETED, ExitCode [0-0]
- [doduo] Slurm Array Summary Job_id=64887583_* (64887583) Name=msa_pulldown Ended, Mixed, MaxSignal [125]
- [doduo] Slurm Array Summary Job_id=64315268_* (64315268) Name=msa_pulldown Failed, FAILED, ExitCode [1-1]
In the case where not all runs succeeded, you can look at the error logs to see what went wrong. You can find those with the name error_msa.log-X in the output directory, with X being the index. The most likely error here is that there was a memory (RAM) shortage. In this case, at the bottom of the file there will be an error that looks like this:
slurmstepd: error: Detected 1 oom_kill event in StepId=64886728.batch. Some of the step tasks have been OOM Killed.
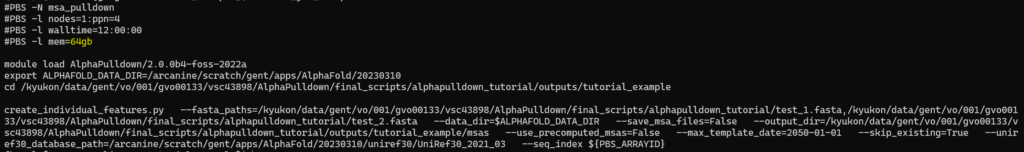
To circumvent this, you can increase the allocated memory and submit the job again, in the same manner as before (already computed MSAs will be skipped so there is no computational overhead for this). To increase the allocated memory, open the msa_job_script.sh and increase the number at the mem line, shown in yellow here:
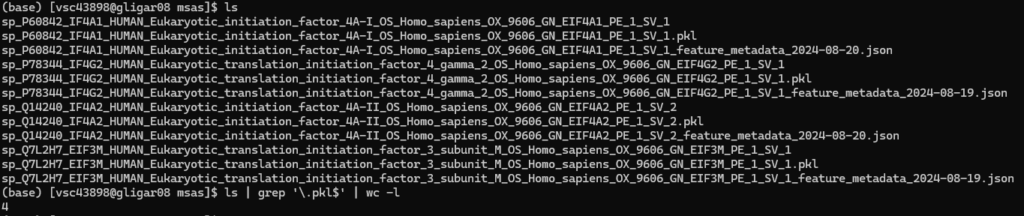
You can verify that all MSA runs are finished by going into the msas and see if .pkl files were generated for all proteins (they are used in the next steps). In this example, the 5 entries in the FASTAs had 4 unique proteins, and so four .pkl were generated. You can automatically check the count by running ls | grep '.pkl$' | wc -l
Step 2. Protein complex structure prediction
Once all MSAs are generated, you can launch step 2 by following the instructions as you did in the first step.
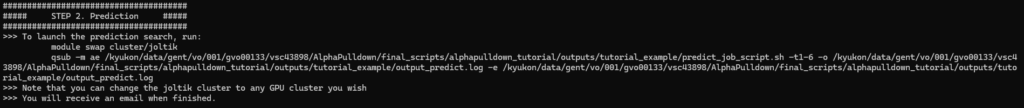
You will again receive an email when all jobs are finished. Predictions can be found in the preds directory. Possible errors might arise if the protein ids in the FASTA file would contain special non-alphabetic characters (allowed: (space) | _ = and more)
Step 3. Generate results overview
Finally, an overview of the predicted interactions can be generated in this last step. This step will again be executed on a CPU cluster, and should take a shorter time than the other steps.
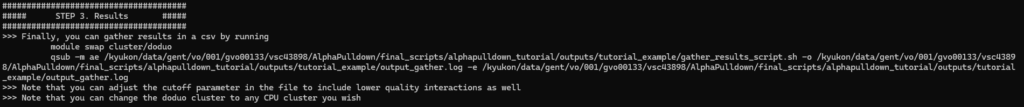
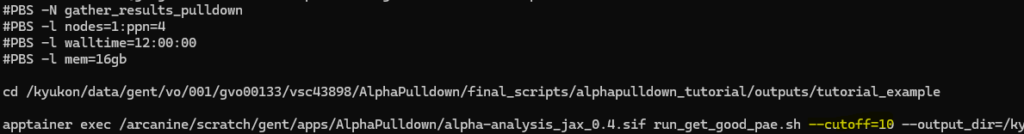
Once finished, you will again receive a mail. The final results can be found in the preds/ directory, in predictions_with_good_interpae.csv (easy to view with Excel for example). Note that interactions will be only included here if they pass the average interface PAE threshold of 10. This is done to reduce computational overhead, as interactions with low PAE are unconfident predictions and will almost never result in accurate interactions. If desirable, you can increase this cutoff in the gather_results_script.sh file:

(for better readability of the file, download and open in Excel)
(short) Extra: visualize promising interactions
AlphaPulldown also includes support for a Jupyter Notebook that visualizes predictions above a certain cutoff. You can create the notebook by running these commands from within the preds/ directory:
module swap cluster/doduo
module load AlphaPulldown/2.0.0b4-foss-2022a
create_notebook.py --cutoff=5.0 --output_dir=.
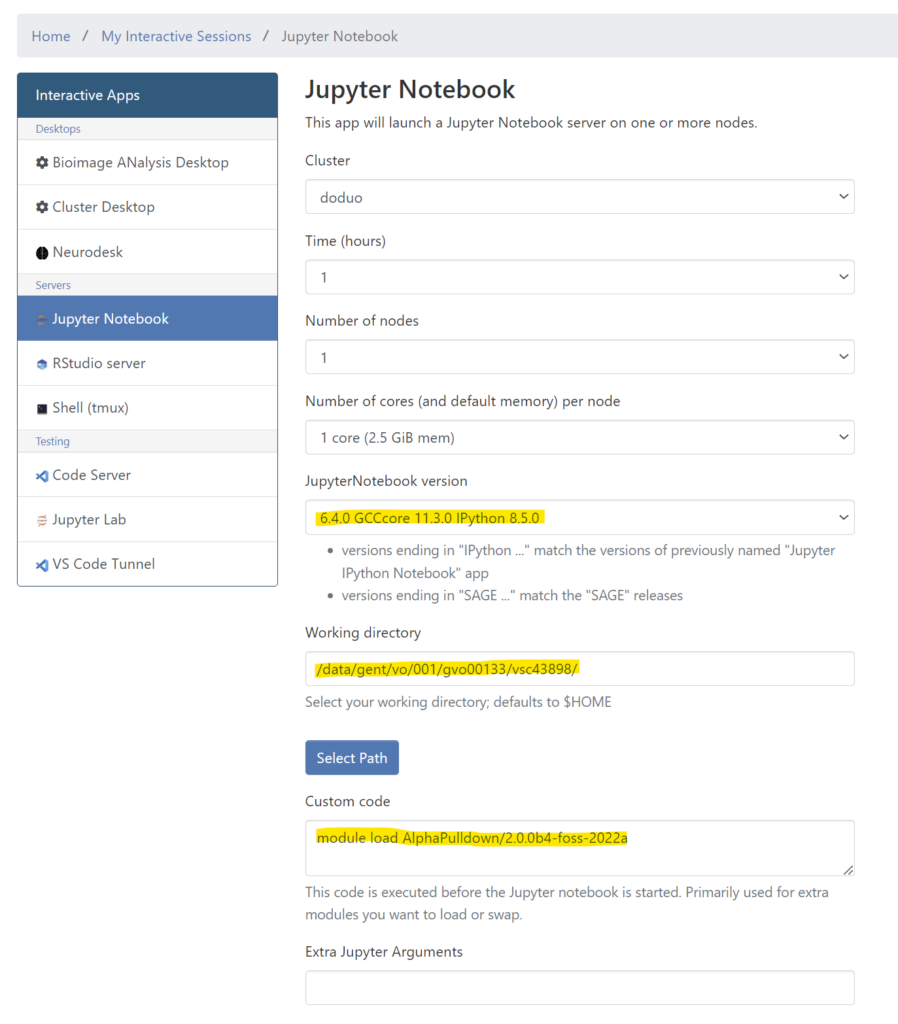
If the notebook is successfully created (output.ipynb within the preds/ directory), log in to login.hpc.ugent.be and go to Interactive Apps > Jupyter Notebook. Make sure to select the right version, fill in the working directory from where you will start browsing, and the Custom code block to load the AlphaPulldown module.
Then, launch the session, browse to the notebook and open it. After opening, just select the default suggested Python kernel, and then you can run the notebook by choosing Run > Run All Cells. If the notebook does not contain any predictions, have a look at the selected cut-off, and whether there are any predictions with an inter-PAE score below it. Otherwise, you can increase the cut-off score.
After running all cells, you should see these visualizations per interaction: