Scales define what the axes and the legend look like
How to use a log scale?
You can use the trans argument of scale_x_coninuous() and scale_y_continuous():
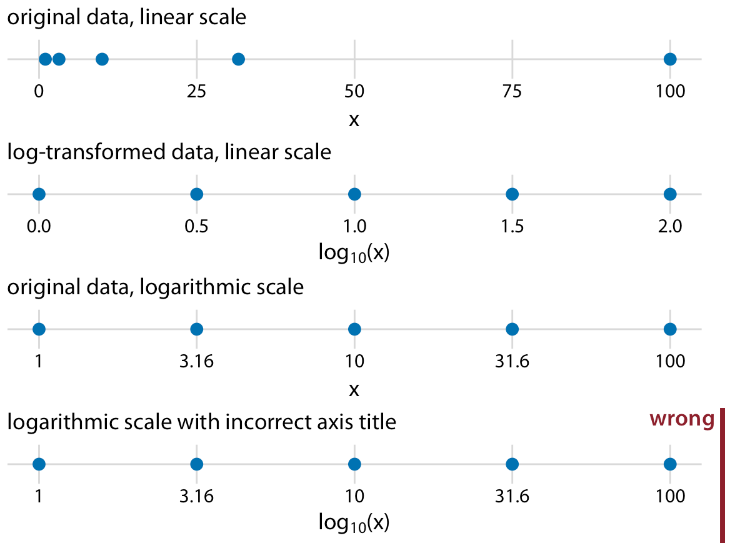
p + scale_x_continuous(trans='log10')will transform the X axis into log scale. This only works when the X axis represents continuous data.
Note that this does not mean that the data has been log transformed, only the axis has changed. Make sure you use the correct title for the axis:
How to generate a second Y-axis?
How to define the shapes of a point geom?
How to change the color palette of the graph?
Quizzes