Visualize a phylogenetic tree with ggtree
Phylogenetic trees are used to show evolutionary relationships among organisms. In infectious disease research, phylogenetic trees are usually built from pathogens’ protein sequences to show which pathogen is genetically closer to another, providing insights into the potential source of an outbreak.
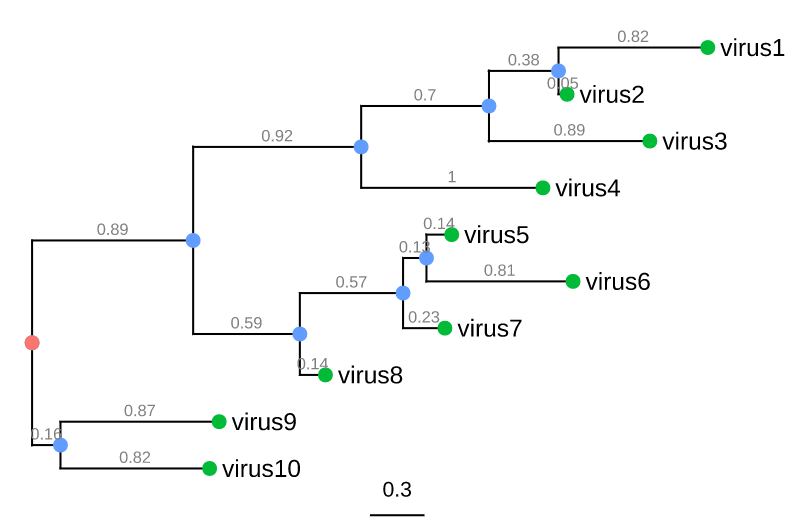
Trees consist of nodes and branches:
- External nodes (green circles) represent organisms sampled and sequenced e.g. viruses
- Internal nodes (blue circles) represent hypothetical ancestors for the sequenced organisms
- The root (red circle) is the common ancestor of all species in the tree
- Horizontal lines are branches and represent evolutionary changes (gray number) measured in a unit of time or genetic divergence
- The bar at the bottom provides the scale of these branch lengths
There are many methods and tools to create phylogenetic trees (Phylip, PAUP+, MrBayes) and there are many file formats to store phylogenetic trees. The Newick format is the standard for most software in evolutionary biology and is also supported by the ggtree package.
Import the tree
The package treeio supports various tree formats (see overview). You can use read.tree() or read.newick() to import .nwk files.
library(ggtree)
library(treeio)
nwk <- read.tree("Rdata/tree.nwk")
The file in converted into a list upon import.
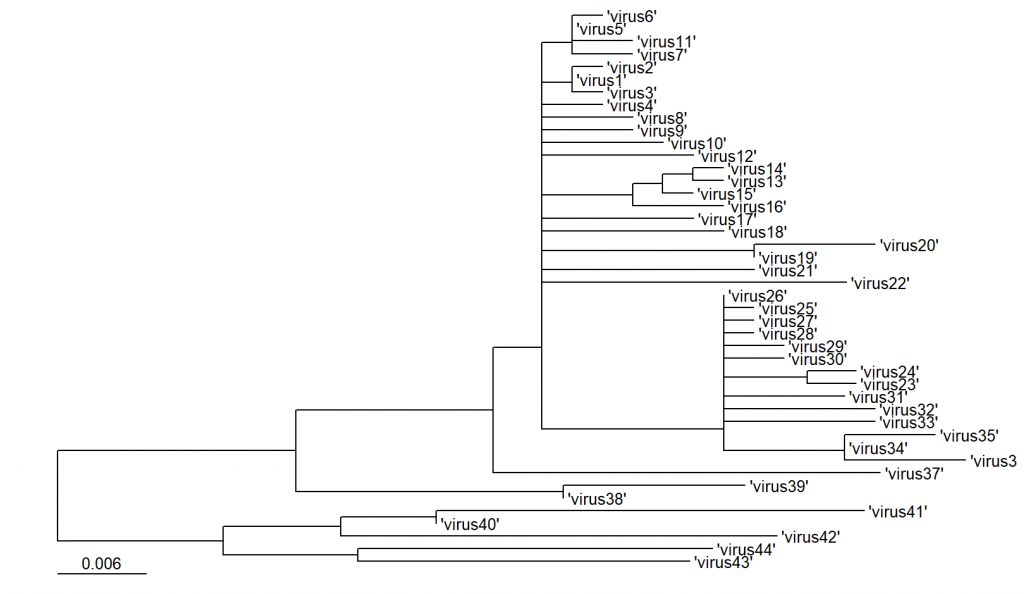
Visualize the tree
Trees are generated using ggtree(), that uses this list as input. To facilitate tree visualization, the ggtree package provides several layers, e.g.
- geom_treescale() for adding a legend of tree branch scale (genetic distance, divergence time)
- geom_tiplab() to add labels to the external nodes
See overview of all these layers.
ggtree(nwk) + geom_treescale(x=0) + geom_tiplab()The x argument sets the vertical position of the scale.