Add p-values to a plot
How to add a p-value to a plot?
You need the ggsignif package for this.
First make the plot, then add a significance geom to the plot:
library(ggsignif)
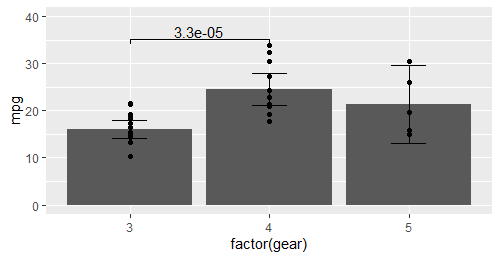
p <- ggplot(mtcars,aes(factor(gear),mpg)) + ...
p + geom_signif(comparisons=list(c("3","4")),test="t.test",test.args=c(var.equal=TRUE))The comparisons argument is mandatory: it defines which values on the X axis will be linked by a p-value line, so the value of this argument is a list of values on the X-axis (= names of categories so in between quotes!) that you want to connect. In this example the p-value line will start at category 3 and end at category 4.
The test argument specifies which test R needs to do to calculate the p-value that is displayed on top of the line. The test.args argument specifies the argument settings for this test: in the t test set the var.equal argument to TRUE.
How to set the p-value yourself?
You can manually add p-values to plots using the annotation argument of geom_signif() e.g.
p + geom_signif(comparisons=list(c("3","4")),annotation="p=0.005")